Time Travel Debugging (Linux)
Time travel debugging (TTD) allows you to record an execution trace of a program or system and replay it back and forth. It can speed up the process of reverse engineering/vulnerability research, and deal with certain tasks that are not easy to handle in regular forward debugging.
Several tools implement TTD. On Linux, Binary Ninja debugger has a GDB RSP adapter which can be used to replay/debug the trace produced by rr. The combination of TTD and your familiar reverse engineer tool would hopefully supercharge the ability to time travel and make your workflow even more effective.
Below is a guide to set it up.
Install rr
- Download and install the latest release from https://github.com/rr-debugger/rr/releases
Record an rr Trace
- Record a trace with
rr your_program arg1 arg2 - This saves the trace into the default directory (
$HOME/.local/share/rr). To specify a custom directory, use-o target_dir - For more options during the record, check out
rr record -h
Replay an rr Trace
- Run
rr replay -h 0.0.0.0 -s 31337 - This will instruct rr to spawn a GDB stub and listen on port 31337 of all interfaces
- It will replay the last recorded trace. To replay a different trace, specify the trace directory on the command line
- For more options during the replay, check out
rr replay -h
Connect to the gdb stub in Binary Ninja
- Open the binary file in Binary Ninja (optional)
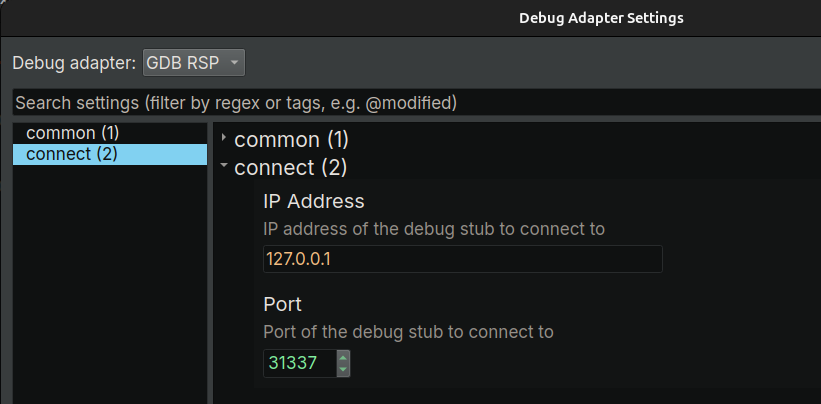
- Click Menu -> "Debugger" -> "Connect To Remote Process", the
Debug Adapter Settingswill popup - Select
GDB RSPas the debug adapter - Type in the
IP AddressandPortin the previous step - Click
Accept
Debug the rr Trace
- Once connected, the debugger should be paused within the loader (ld)
- Now resume the target once, and the target should be paused at the program entry point
- Most of the debugger functionalities should work in the very same way as a forward debugging
- The control buttons in the debugger sidebar widget shows four new buttons for reverse debugging on the right side:
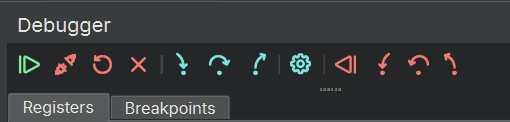
- These new buttons are in red color and flipped
- You can hover over the button to see what they do and the keybindings for them