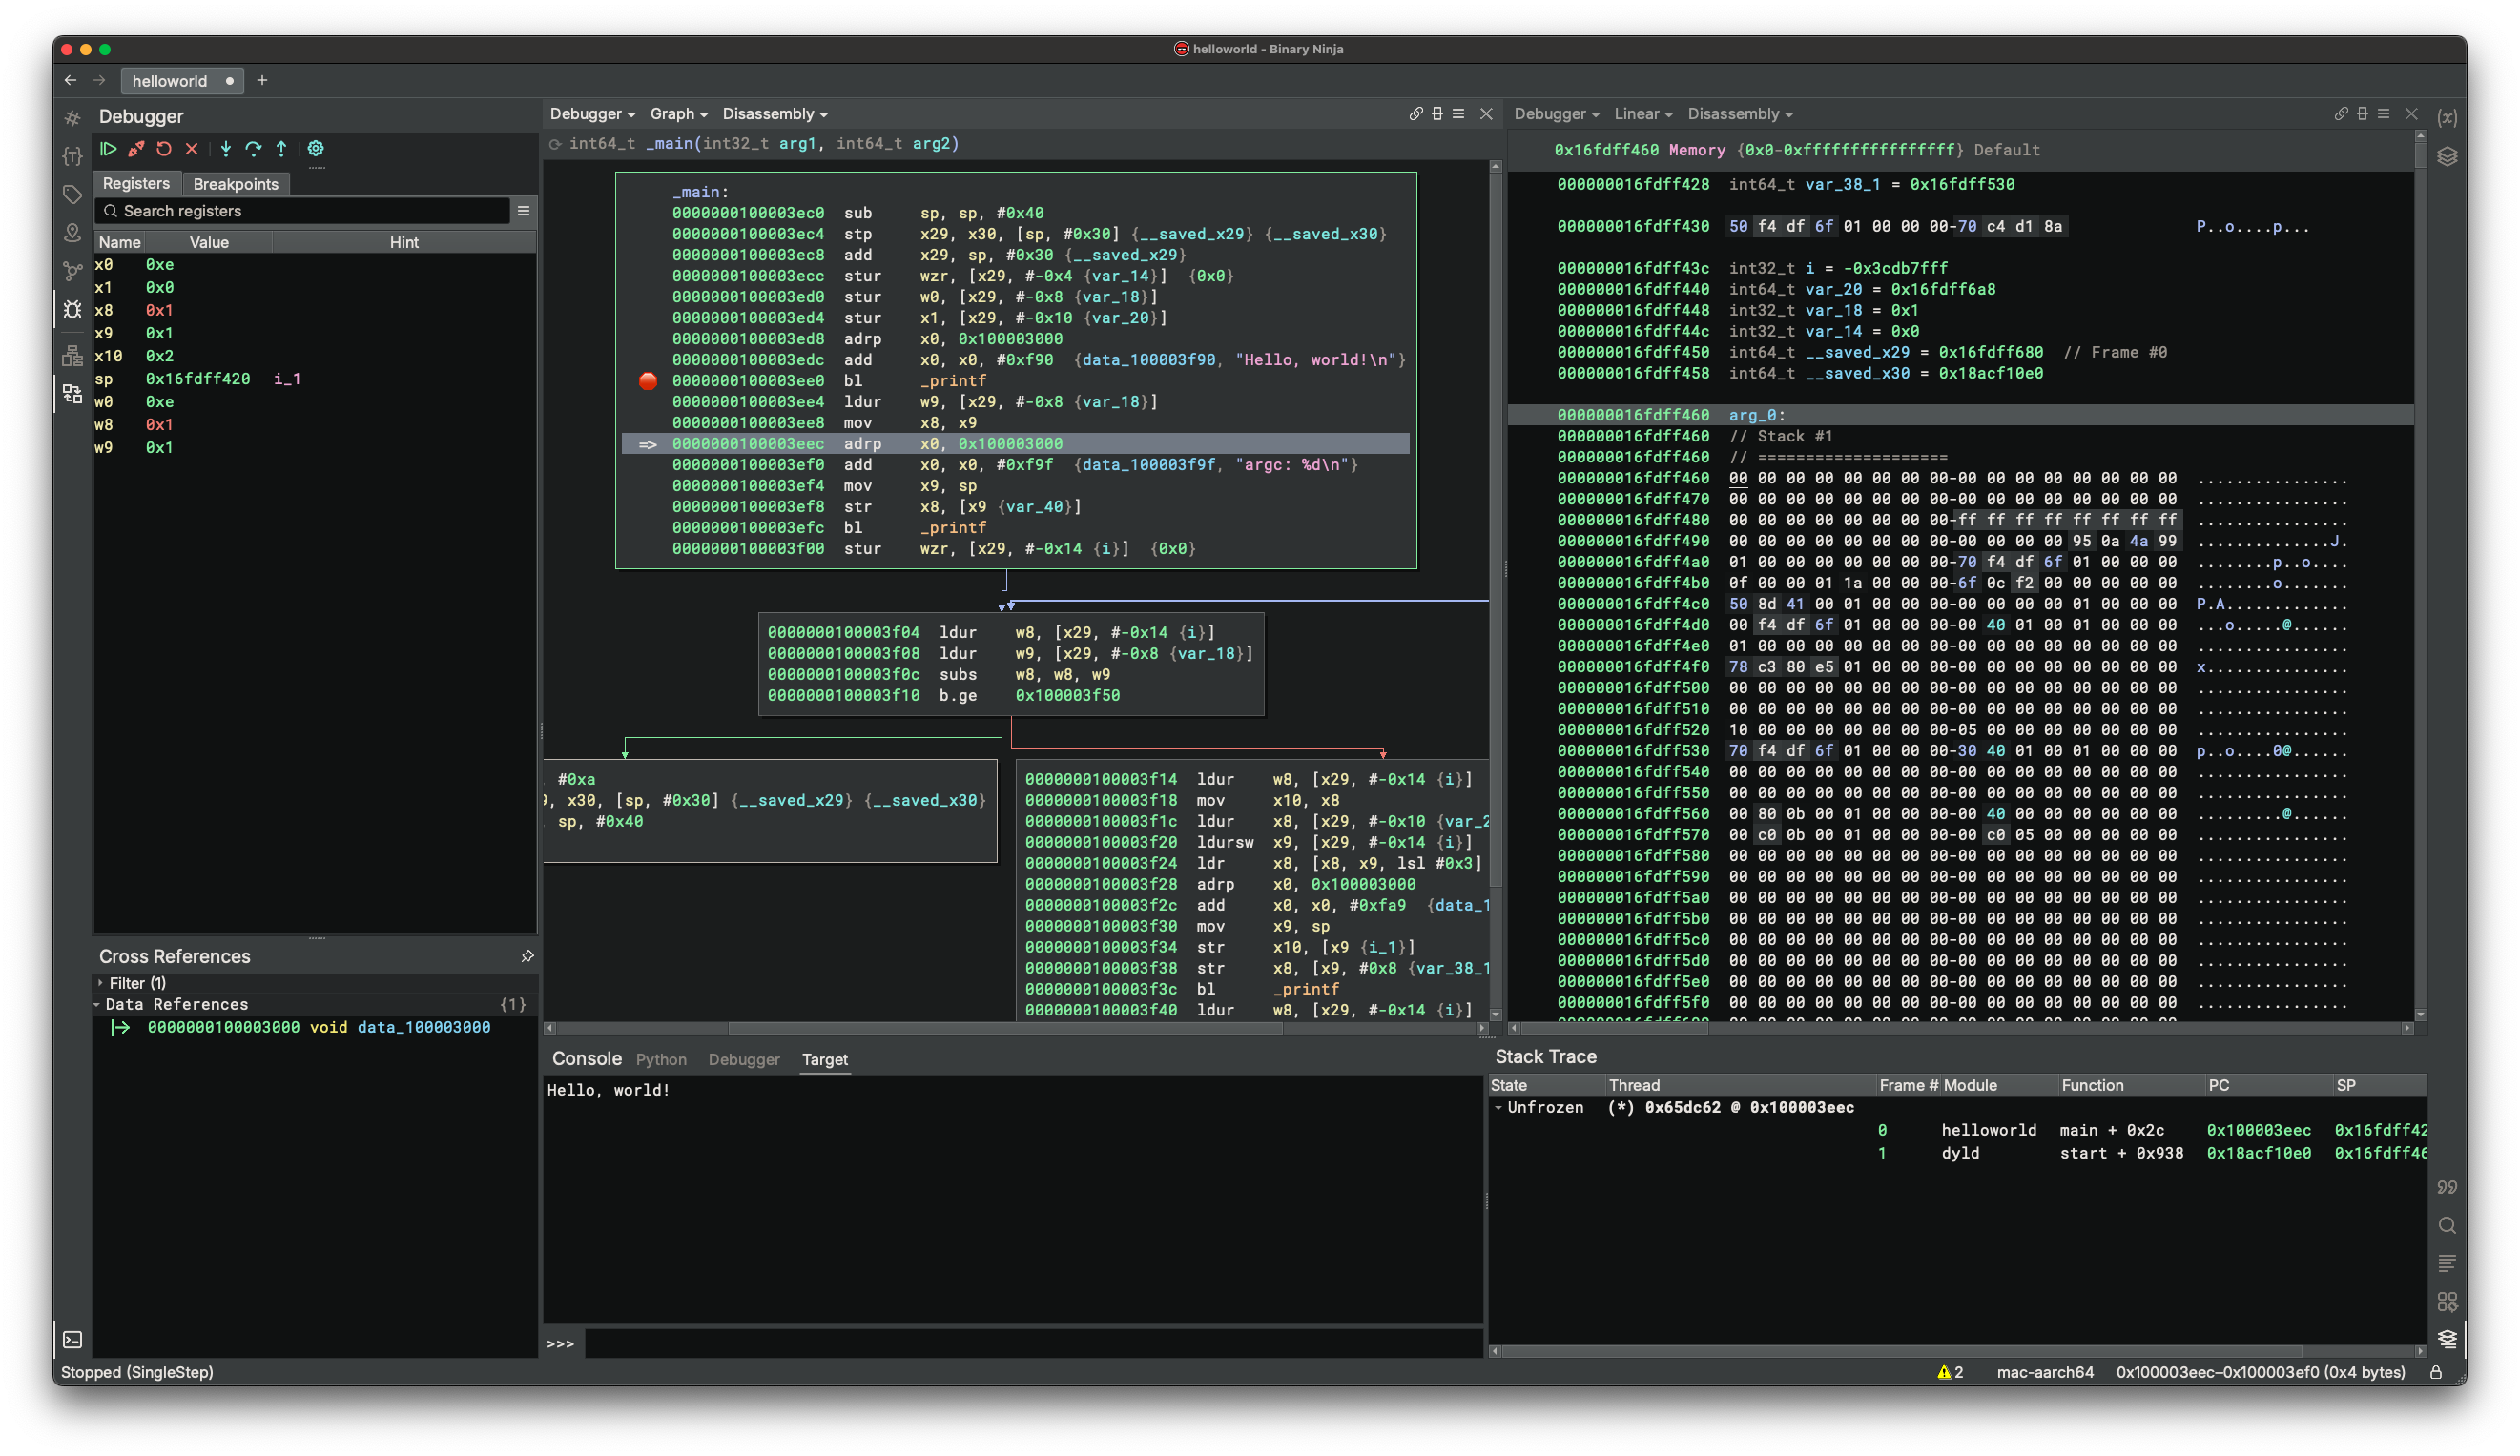
Debugger
Binary Ninja Debugger is a plugin that can debug executables on Windows, Linux, and macOS, and more!
The debugger plugin is shipped with Binary Ninja. It is open-source under an Apache License 2.0. Bug reports and pull requests are welcome!
Platform and Target Support
This is the current comparability matrix of the debugger. The columns stand for where we run BN and the rows stand for the targets.
| Target 🔽 Host ▶️ | macOS | Linux | Windows | Note |
|---|---|---|---|---|
| macOS user | Yes (Local/Remote) | Yes (Remote) | Yes (Remote) | |
| Linux user | Yes (Remote) | Yes (Local/Remote) | Yes (Remote) | |
| Windows user | #70 | #70 | Yes (Local/Remote) | |
| Windows PE (via wine) | No | Yes (Local) | No | [1] |
| GDB Server | Yes | Yes | Yes | |
| GDB RSP (QEMU/VMWare/Qiling/Android) | Yes | Yes | Yes | |
| GDB Machine Interface | #170 | #170 | #170 | |
| LLDB Server | Yes | Yes | Yes | |
| iOS/debugserver | Yes | Yes | Yes | |
| Windows Kernel | No | No | Yes (Local/Remote) | |
| Windows TTD (WinDbg) | No | No | Yes (Local) | |
| Linux TTD (rr) | Yes (Remote) | Yes (Local/Remote) | Yes (Remote) | |
| Windows Dump File | No | No | Yes (Local) | |
| Corellium | Yes (Remote) | Yes (Remote) | Yes (Remote) |
Notes: [1] Requires wine and winedbg. See Wine Debugging Guide for setup instructions.
The progress is also tracked in issue #122.
UI
The debugger UI mainly consists of six parts:
- debugger sidebar
- debugger menu
- global area panels
- debugger status widget
- debugger context menu
- stack variable annotations
Debugger Sidebar
Clicking the debugger sidebar button (along the left edge of the main window, the one that looks like a bug) will activate the debugger sidebar.
The debugger sidebar contains three widgets: the control buttons, the register widget, and the breakpoint widget.
Control Buttons
There is a row of buttons at the top of the debugger sidebar. They control the execution of the target. The behavior of each button is hopefully intuitive from its icon. You can also hover over the button to see the name of the icon.
Buttons that do not work for the current target status are disabled. For example: before launching the target, the Step Into button is disabled.
A common scenario is to click the left-most button to launch the target and then use the buttons on the right to resume the target, step into/over/return. The Pause button can be used to break into the target while it is running.
For Step Into and Step Over, if the current view is viewing an IL function, then the operation appears to be performed on that IL, offering a source-code debugging-like experience. However, the underlying operation is still performed at the disassembly level because that is the only thing the backend understands. The high-level operations are simulated, i.e., the debugger may decide to step the target multiple times before finally yielding the control. These are transparent to the users.
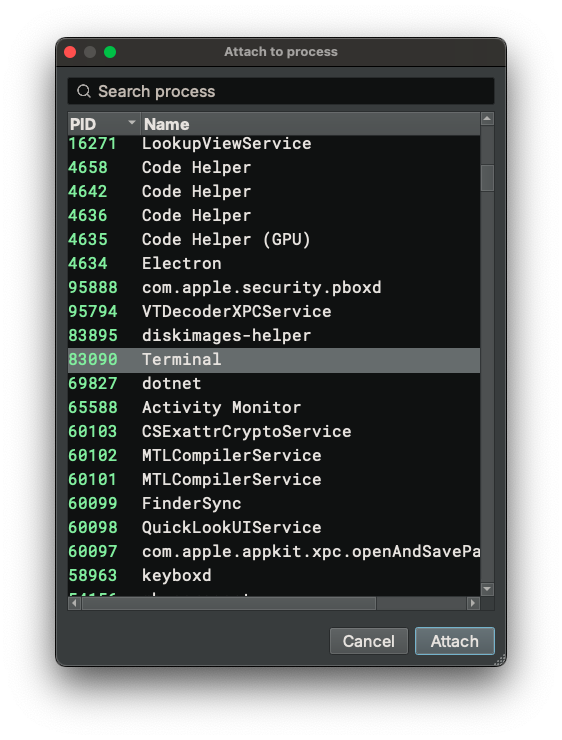
When the Attach To Process... button is clicked, a dialog pops up and shows all the running processes on the system. Selecting one of them and clicking Attach will attach to the process.
The wheel button opens the Debug Adatper Settings dialog which will be explained below.
Register Widget
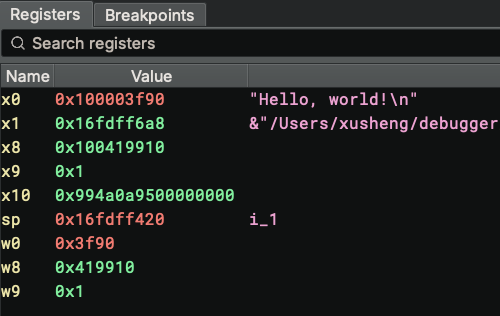
Register widget lists registers and their values. A hint column presents anything interesting pointed to by the register. Currently, only strings and pointers to strings are considered. In the future, we would also annotate variables.
Double-clicking a value enters editing mode, and the user can type in new values for the register. The new value is parsed as hex.
The register widget tracks the last seen value of registers and provides visual feedback. Unchanged values are colored white, changed values are colored blue. User-edited values are colored orange.
An experimental feature is added to shorten the list: registers with a value of zero are not shown in the list. To disable it temporarily, right-click and unselect "Hide Unused Registers".
Breakpoint Widget
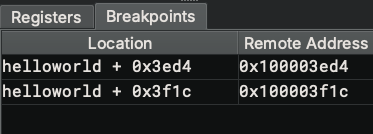
The breakpoint widget lists breakpoints in the target. The columns are:
- E (Enabled): Checkbox indicating whether the breakpoint is enabled. Click to toggle.
- Location: The address in the format of
module + offset - Remote Address: The absolute address in memory
- Type: The breakpoint type:
S- Software breakpointHE- Hardware execution breakpointHR- Hardware read watchpointHW- Hardware write watchpointHA- Hardware access (read/write) watchpoint- Condition: The conditional expression (if any)
The context menu of the widget offers several options:
- Jump to Breakpoint: Navigate to the breakpoint address
- Remove Breakpoint: Delete the selected breakpoint
- Add Breakpoint...: Add a new software breakpoint at a specified address
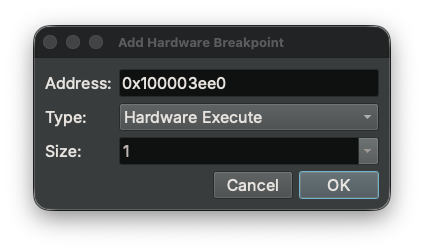
- Add Hardware Breakpoint...: Open the hardware breakpoint dialog to add a hardware breakpoint or watchpoint
- Toggle Enabled: Enable or disable the selected breakpoint(s)
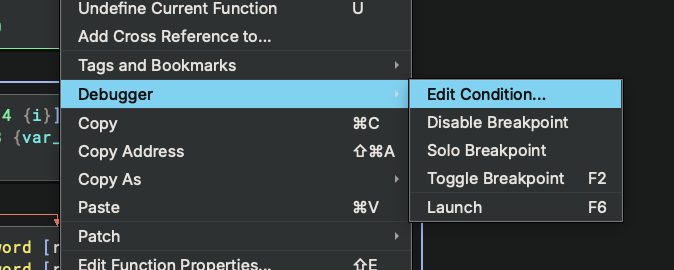
- Edit Condition...: Set or modify a conditional expression for the breakpoint
- Enable All Breakpoints: Enable all breakpoints
- Disable All Breakpoints: Disable all breakpoints
- Solo Breakpoint: Disable all breakpoints except the selected one
Conditional Breakpoints
Conditional breakpoints allow you to specify an expression that is evaluated each time the breakpoint is hit. The debugger only stops if the condition evaluates to a non-zero value (true). If the condition evaluates to zero (false), execution continues silently.
Conditions are evaluated using Binary Ninja's expression parser, which supports:
- Register values (e.g.,
rax,rsp,eip) - Arithmetic operations (e.g.,
rsp + 0x20) - Comparisons (e.g.,
rax == 0x1234) - Memory dereferences (e.g.,
[rsp],[rax + 0x10])
Example conditions:
rax == 0x1234- break when RAX equals 0x1234rsp + 0x20- break when the expression is non-zero[rsp] == 0- break when the value at the stack pointer is zero
Debugger Menu
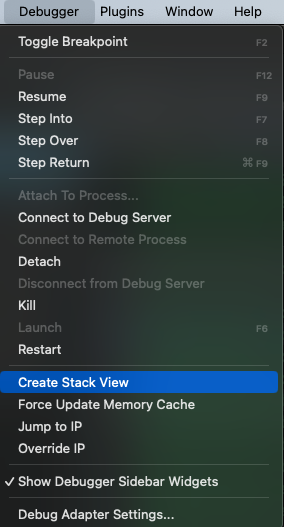
There is a Debugger menu in the main window menu bar.
It contains duplicates of the debugger control operations available via icons and also shows the hotkeys bound to those actions.
There are several useful actions in the debugger menu that are worth explaining:
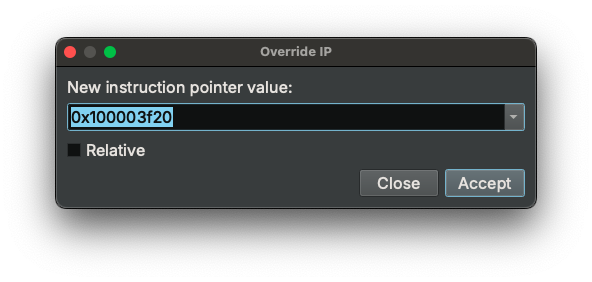
Create Stack Viewsplits the active view and navigates to the stack pointer value in the new pane. Very useful for viewing stack variables.Jump to IPnavigates to the value of the instruction pointer. This is especially helpful when one explores the binary and wishes to get back to the current instruction.Override IPallows changing the instruction pointer value. This is useful when we wish to revert a branch -- simply set the new IP at the other target of the branch. The new IP defaults to the currently selected address. A dialog will pop up after clicking this action, which allows confirming and editing the new IP.
Debug Adapter Settings Dialog
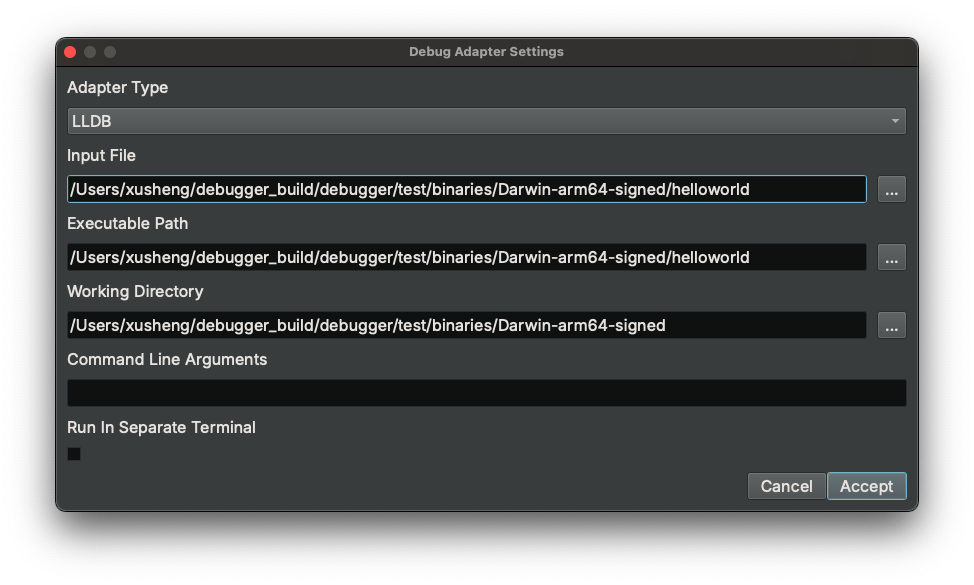
The Debug Adapter Settings... menu item will trigger a Debug Adapter Settings dialog. It can also be opened via the
wheel button in the control buttons widget.
This dialog is shown to you when you launch/attach/connect to a target for the first time. On subsequent operations, the last settings will be used and the dialog will not show up. If you wish to change them, you need to manually open the dialog.
Within this dialog, you can select which the debug adapter to use, as well as configure debugger settings such as command-line arguments or the working directory.
The Executable Path specifies the path of the executable to run, and Input File specifies the input file used to create the database.
These two should be the same if you wish to debug the code in an executable.
However, if you wish to debug a shared library or DLL, they should be different -- the Input File will be the library or DLL you opened in Binary Ninja, while Executable Path will be the executable that loads the library or DLL.
For example, if you wish to debug a sample.dll on Windows, then you should open the sample.dll in Binary Ninja, and configure the adapter as follows:
Input File: path of sample.dll
Executable Path: C:\Windows\System32\rundll32.exe (or the .exe that loads the DLL)
Every adapter provides a different list of settings. For more details, please refer to the Settings section.
Global Area Panels
The debugger adds four new global area widgets: Target Console (terminal), Debugger Console, Stack Trace, and the Modules List.
Target Console
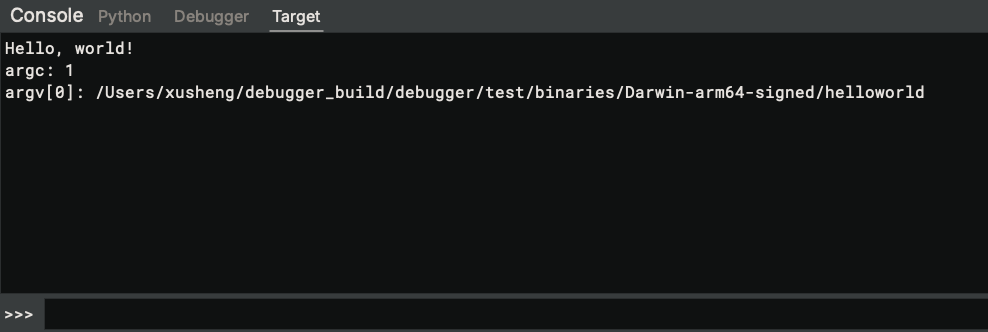
The Target Console panel simulates a terminal for the target. If the process writes to stdout, the content will be printed here. There is an input box at the bottom, and anything entered into it will be sent to the target's stdin.
Due to a backend limitation, this feature only works on macOS and Linux. On Windows, the target always runs in its own external terminal and all input/output happens there.
On macOS and Linux, the default setting redirects the stdin/stdout here. However, if the user configures the target to run in its terminal (by calling dbg.request_terminal_emulator = True), then the stdin/stdout will not be redirected, and need to be accessed in the target's terminal.
Debugger Console
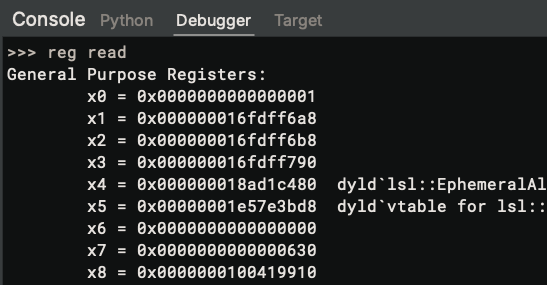
The debugger console allows the user to execute backend commands and get the result. Feel free to use it if you are more comfortable with issuing LLDB/WinDbg commands rather than clicking the buttons. It can also be helpful for advanced debugging scenarios or when you need features specific to the backend. For some useful commands, see the docs below.
On Linux and macOS, the backend is based on LLDB and the console accepts LLDB commands.
On Windows, the backend is based on Windows Debugger Engine, and it supports WinDbg command syntax. All WinDbg base
commands are supproted and can be
used directly. Certain extension commands, e.g., !peb, requires first installing the full WinDbg following this
guide.
The console supports commands that resume the target, e.g., stepping.
Like the Python console, all addresses in the debugger console is clickable -- clicking it navigates to the address.
Stack Trace
The stack trace widget lists all the threads along with the stack frames.
When the target stops, the active thread is expanded and its stack frames are displayed. Stack traces for other threads are collapsed by default and can be expanded from the UI.
Double-clicking the addresses in the PC (program counter), SP (stack pointer), and FP (frame pointer) column navigates to the address.
The active thread is marked with (*). Double-clicking another thread will set that as the active thread. As a result, the register widget will show the registers from the new active thread.
The stack trace is symbolized using both information from the analysis and the debug adapter backend.
In the above screenshot, we can see that function names like MD5Update and MD5Init are from the analysis (named by
the user), and the start function in the dyld module comes from the LLDB backend, which can read symbols from other
modules other than the current one.
The context menu offers to suspend and resume each thread individually. A convenience method is offered to make a thread "solo", which suspends all other threads and resumes the thread. Note, resuming the thread does NOT cause the thread to start executing immediately. It only makes the thread execute the next time the target is resumed, e.g., by pressing the Go or Step Over button. There are some known issues when suspending/resuming individual threads with LLDB adapter.
Module Widget
The module widget shows the start/end address, size, name, and path information of the target's modules.
Double-clicking the addresses navigates to the address.
Note: on macOS 13, the size of system dylib are calculated wrong. The bizarrely huge size is caused by dyld_shared_cache on macOS, which will be addressed in the future. The size of the main executable is still calculated correctly.
Debugger Info Widget
The debugger info widget shows the relevant information of the current (or selected) instruction. It shows the value of registers, memory read/writes, as long as any hints if the value can be dereferenced. The goal is to provide more context for the target and offer the relevant information directly.
If the selected instruction is a function call, the call parameters are listed:
If the selected instruction is a conditional branch, the values being compared are listed and the result (token or not taken) are predicted:
Please be aware that the widget always uses the target's current status (registers, memory) to calculate the value of the requested expressions. If you select an instruction different from the active one, the value could be wrong even if it could be calculated.
Debugger Status Widget
A debugger status widget is added to the main window's status bar. It indicates the current status of the target.
For example, when the target stops, it will include the reason for the stop. When the target exits, the exit code is reported. When an error occurs during certain operations, an error message will also be displayed here.
The widget shows the status of the debugger for the current binary view if a debugging session is active.
Context menu
The debugger registers a series of useful actions along with keyboard shortcuts. These shortcuts can be customized using Binary Ninja's keybindings support.
Among these actions, target control actions, e.g., Run/Step Into have the same effect as the control buttons in the sidebar.
Toggle Breakpoint adds a breakpoint at the current location if there is no breakpoint; otherwise, the existing breakpoint is removed.
Edit Breakpoint Condition... allows you to set or modify a condition for the breakpoint at the current location. See Conditional Breakpoints for more details.
Run To Here lets the target execute until the current line is hit.
[//]: # (Make Code is an experimental feature that displays the selected region as code. If the region is indeed code, the user can use P to create a function there. Note that we recommend in most situations that p be used, or if some code is incorrectly associated with another function, the fix is resolving the reason for that mistake. For example, adding a No Return property to a function.
Stack Variable Annotation
Note: stack variable annotation is disabled by default because it is sometimes inaccurate.
It can be turned on by setting debugger.stackVariableAnnotations to true.
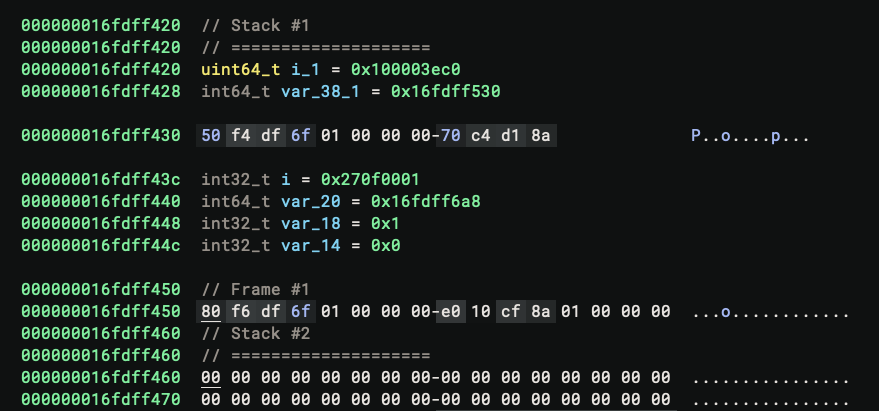
When the target breaks and a stack trace is available, the debugger annotates the stack variables in the linear view as data variables.
The above image shows the annotated stack with two stack frames. The start and end of each stack frame are marked, and stack variables are defined according to the stack variables in the functions.
To quickly create a split view that views code and stack side-by-side, in the main window menu, click Debugger->Create Stack View.
Only the stack frames and variables of the current (active) thread are annotated to avoid confusion. If you wish to view stack variables from a different thread, first switch to that thread in the Stack Trace global area panel.
The annotation is done only when there are at least two frames in the stack trace. This is a known limitation, and we will address it later.
Other UI Elements
On every line that has a breakpoint, there are two visual indicators:
- the line is highlighted in red
- a breakpoint indicator (🛑) is added to the left
On the line where the program counter is at, there are two visual indicators:
- the line is highlighted in blue
- a program counter indicator (➞) is added to the left
Design
Debug Adapters
The goal of the Binary Ninja debugger is to provide a unified way of debugging programs on different platforms (e.g., Windows, Linux, macOS, etc). However, this is not an easy task, because each platform has its own way of supporting debugging and it varies considerably.
To deal with this, we abstract the core functionalities of a debugger into a class DebugAdapterType. Each debug adapter is a subclass of the DebugAdapterType with the platform-dependent implementation of each method.
The debugger then drives the various adapters, creating a unified debugging experience, both in GUI and API.
The currently available debug adapters are:
- DbgEng adapter: for local and remote Windows user program debugging. Windows only
- DbgEnd TTD adapter: for time-travel debugging (TTD). Windows only
- Windows kernel debugging adapter: for remote Windows kernel debugging. Windows only
- Windows local kernel debugging adapter: for local Windows kernel debugging. Windows only
- Windows dump file adapter: for loading Windows dump files. Windows only
- LLDB adapter: For local and remote debugging of Linux/macOS user program debugging. Works on Windows, Linux, and macOS.
- GDB RSP adapter: For debugging anything that speaks the GDB RSP protocol, e.g., gdbserver, QEMU, VMWare, Qiling, rr, etc. Works on Windows, Linux, and macOS.
- Corellium adapter: A variant of the GDB RSP adapter specifically tailored for debugger virtual devices in Corellium. Works on Windows, Linux, and macOS.
Each debug adapter supports one or more operations to initialize the debugging:
- Launch: launch a target and then debug it. The actual operation depends on the adapter. For example, DbgEng adapter launches a process, while DbgEng TTD adapter starts the replay of a recorded TTD trace
- Attach: Attach to a running target and debug it. The target is usually a process identified by a PID
- Connect to a remote process/debug server: Connect to a remote target or debug server. See the section on remote debugging for more details
Each adapter may provide a list of configuration options. They can be configured via the debug adapter settings dialog.
New debug adapters can be created by subclassing DebugAdapterType to support other targets.
The Debugger Memory Region
Starting from 4.1.5542-dev (0ad6b08b), the debugger no longer involves two binary views during debugging. Instead, it always uses the incoming binary view (e.g., PE view) that is used to create the controller. Memory regions that are not present in the original binary view are represented using the new Memory Map/Region API.
These regions get added automatically when the target is launched, and gets removed after debugging. Analysis is no longer lost after debugging.
During debugging, the binary view reads and writes its memory from the connected DebugAdapterType backend.
Writing to it will also cause the target's memory to change.
The binary view can be accessed by the data property of the controller.
API
The debugger exposes its functionality in both the Python and C++ APIs. The Python documentation can be accessed online, for stable and dev version.
The API is centered around the DebuggerController class, which provides all functionalities of the debugger. There is no need to directly access the DebugAdapterType classes.
When the debugger is used within the UI, the dbg magic variable is injected into the Python interpreter. It always represents the debugger for the currently active Binary View. You can think of it as being created by
dbg = DebuggerController(bv)
where bv is another magic variable that always represents the current BinaryView.
You can simply run dbg.launch_and_wait() in the Python console to launch the target.
For all of the API functions that resume the target, e.g., go, step into, etc, there are two variants of them. One of them resumes the target and waits for it to stop again synchronously, e.g., step_into_and_wait will do a step into, and it only returns after the target stops again. This is more frequently used, and is suitable for automating a series of sequential actions. However, after calling such a synchronous API, if for any reason the target does not stop as expected, Binary Ninja might be confused or hang.
The second set of API works asynchronously. For example, step into will only do a step into, but does NOT wait for the target to stop again. Usually the asynchronous API is used with register_event_callback to listen for the relevant events (e.g., target resumed, stopped, etc). The asynchronous API is harder to use and is only recommended when the synchronous version does not suit your need. The Binary Ninja debugger UI uses the asynchronous API.
How-to Guide
Here is an incomplete guide on how to get started with the debugger, covering most of the basics on operations in the debugger.
Launch and Control the Target
There are several ways to launch the target:
- Use the control buttons at the top of the debugger sidebar
- Use the debugger main window menu
- Use the debugger context menu or its keybindings (
F7,F8, etc) - Run LLDB/WinDbg commands in the debugger console
- Run
dbg.go(),dbg.step_into(), etc. in the Python console.
Configure Launch Parameters
- Click "Debugger" -> "Launch/Connect Settings..." in the main window menu, and edit parameters in the dialog
- Directly set the value of
dbg.cmd_line,dbg.working_directory,dbg.working_dir, etc
Add/Remove Breakpoints
- Select the line, use the
Toggle Breakpointcontext menu or the debugger main window menu - Select the line, press
F2hot key - Right-click a line in the Breakpoint widget in the sidebar, and select
Remove Breakpoint - Run
dbg.add_breakpoint(address)ordbg.delete_breakpoint(address)in the Python console.
Add/Remove Hardware Breakpoints
Hardware breakpoints use CPU debug registers to monitor code execution or memory access without modifying the target's code. They are useful when:
- Debugging read-only memory or code that checksums itself
- Watching for memory reads/writes at specific addresses (watchpoints)
- The target detects software breakpoints
Note: Hardware breakpoints are a limited resource. Most CPUs support only 4 hardware breakpoints/watchpoints simultaneously.
Using the UI
- Press
F3or selectDebugger->Add Hardware Breakpoint...from the menu - Alternatively, right-click in the Breakpoint Widget and select
Add Hardware Breakpoint... - In the dialog, configure:
- Address: The memory address for the breakpoint (hexadecimal)
- Type: The type of hardware breakpoint:
Hardware Execute- Break when code at the address is executedHardware Read- Break when the address is read (watchpoint)Hardware Write- Break when the address is written (watchpoint)Hardware Access- Break on both read and write (watchpoint)
- Size: For watchpoints, the size of the memory region to monitor (1, 2, 4, or 8 bytes)
- Click OK to add the breakpoint
The dialog automatically suggests Hardware Execute for code addresses and Hardware Read for data addresses.
Hardware breakpoints appear in the Breakpoint Widget with their type indicated in the Type column (HE, HR, HW, or HA).
Using the API
from binaryninja.debugger import DebuggerController, DebugBreakpointType

# Get the debugger controller
controller = DebuggerController(bv)

# Add hardware execution breakpoint
controller.add_hardware_breakpoint(0x401000, DebugBreakpointType.HardwareExecuteBreakpoint)

# Add hardware read watchpoint (4 bytes)
controller.add_hardware_breakpoint(0x601000, DebugBreakpointType.HardwareReadBreakpoint, 4)

# Add hardware write watchpoint (8 bytes)
controller.add_hardware_breakpoint(0x601000, DebugBreakpointType.HardwareWriteBreakpoint, 8)

# Add hardware access watchpoint (read/write, 4 bytes)
controller.add_hardware_breakpoint(0x601000, DebugBreakpointType.HardwareAccessBreakpoint, 4)

# Remove hardware breakpoint
controller.remove_hardware_breakpoint(0x401000, DebugBreakpointType.HardwareExecuteBreakpoint)
The available breakpoint types are:
DebugBreakpointType.HardwareExecuteBreakpoint- Execution breakpointDebugBreakpointType.HardwareReadBreakpoint- Read watchpointDebugBreakpointType.HardwareWriteBreakpoint- Write watchpointDebugBreakpointType.HardwareAccessBreakpoint- Read/write watchpoint
Set Conditional Breakpoints
Conditional breakpoints pause execution only when a specified condition is true. This is useful for debugging loops or functions that are called many times, but you only want to stop under certain circumstances.
Using the UI
- First, add a regular breakpoint at the desired location
- Right-click the breakpoint in the Breakpoint Widget
- Select
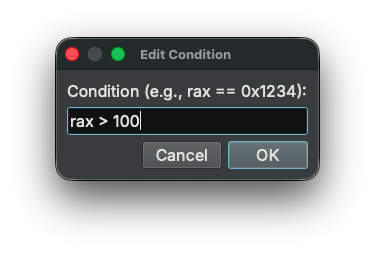
Edit Condition...from the context menu - Enter the condition expression in the dialog
- Click OK to save the condition
The condition will be displayed in the Condition column of the Breakpoint Widget.
To remove a condition, edit it and clear the text field.
Using the Context Menu
You can also set a conditional breakpoint directly from the disassembly view:
- Right-click on a line that has a breakpoint
- Select
Edit Breakpoint Condition... - Enter the condition expression
Using the API
# Set a condition on a breakpoint at an absolute address
dbg.set_breakpoint_condition(0x401000, "rax == 0x1234")

# Set a condition using module-relative address (useful with ASLR)
from binaryninja.debugger import ModuleNameAndOffset
dbg.set_breakpoint_condition(ModuleNameAndOffset("myprogram", 0x1000), "rdi != 0")

# Get the current condition for a breakpoint
condition = dbg.get_breakpoint_condition(0x401000)

# Clear a condition by passing an empty string
dbg.set_breakpoint_condition(0x401000, "")
Condition Expression Syntax
Conditions use Binary Ninja's expression parser. You can use:
- Register names directly:
rax,rbx,rsp,eip, etc. - Arithmetic:
rsp + 0x20,rax * 2 - Comparisons:
rax == 0x1234,rbx != 0,rcx < 100 - Memory reads:
[rsp],[rax + 0x10] - Hexadecimal values:
0x1234,0xdeadbeef
Modify Register Values
- Right-click a value item in the Register widget, type in the new value, and hit enter
- Run
dbg.regs[reg_name] = valuein the Python console - Run
dbg.set_reg_value(reg_name, value)in the Python console.
View/Edit Memory
- Switch to Linear or hex view of the Debugger BinaryView, and view/edit in the normal way
- Get the BinaryView by
dbg.data, and read/write it in the normal way
Navigating the binary
- Double-clicking a value in the register widget, modules widget, and thread frames widget navigates to the address. Note the 0th (first) frame in the stack frame widget usually contains the program counter and the stack pointer, which is used quite often.
- Clicking an address in the debugger console navigates to the address
- Use the
Jump to IPaction to instantly jump back to the current IP - Use the
Create Stack Viewaction to split the view and navigate to the stack pointer in the new pane - Use register values in the expression parser. We can use
regto refer to the value of a register in the expression parser. For example,raxevaluates to the value of theraxregister. We can useeip/rip/pcto navigate to the current program counter, oresp/rsp/spto navigate to the current stack pointer. Thanks to the power of the expression parse, these register values can be combined with other arithmetic operations. This is especially helpful to quickly navigate to the stack variables since they typically have an address likersp+0x20orrbp-0x8, which the expression parser can calculate properly: - Use module names in the expression parser. Similar to the way we can use a register value in the expression parser, we
can also use module names in it. For example,
helloworldwill be resolved to the base address of thehelloworldmodule.
Remote Debugging
Time-travel Debugging (Windows)
See Time Travel Debugging Guide (Windows)
Time-travel Debugging (Linux)
See Time Travel Debugging Guide (Linux)
Windows Kernel Debugging
See Windows Kernel Debugging Guide
Corellium Remote Debugging
See Corellium Remote Debugging Guide
Wine Debugging (Windows PE on Linux)
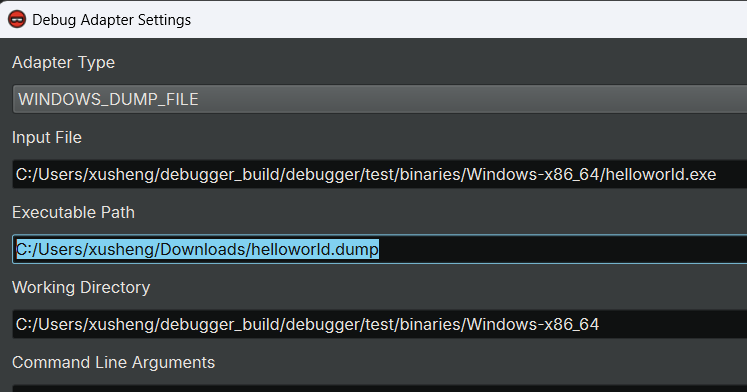
Loading Windows Dump Files
- (optional) Open the executable file used to generate the dump
- Click "Launch", the
Debug Adapter Settingswill popup
- Select
WINDOWS_DUMP_FILEadapter - Set the
Dump File Pathto the path of the dump file - Click Accept and then launch the target
- These information should be available if they have been recorded in the dump file:
- Register values
- Threads and stack traces
- Memory bytes
- Buttons to resume the target would have no effects
Debugging without Opening a File
Normally one would first open a file and then start debugging. However, the debugger can also be used without first opening a file. For example, if you debug a virtual machine or the Windows kernel and do not have a specific module to look at, then there is no motivation to open a file first. Or, if the file is huge and rebasing it takes too long during the launch, then using the debugger directly can save a lot of time.
Below are the steps to use the debugger without opening a file:
- Create an empty mapped file
- In menu, click
File->New Mapped Data - In the popup dialog, select the architecture and platform of your target
- Click
Accept - This step is necessary and it would not work on a
Rawview
- In menu, click
- Configure the debugger
- Open the debugger sidebar
- Open the debug adapter settings dialog by clicking the right-most button in the control buttons area
- Select the appropriate debug adapter
- Set the Executable Path
- Set other fields as needed
- Start debugging as usual
Please be advised when using the debugger in this way, the debugger would not be able to add the initial breakpoint at
the entry point (because the debugger does not have analysis information about the target). The target will execute on
its own freely. One can set the debugger.stopAtSystemEntryPoint setting to true and which will stop the target at a
proper time.
Note, this does not work if you first create a raw view and then create a mapped view from it -- you must directly create a mapped view in the above way.
Running Debug Adapter Backend Commands
Although the debugger already provides UI interfaces for most its functionalities, there are still plenty of features that do not have a readily available UI. luckily, since we the debugger is using WinDbg/LLDB as backends, we can do plenty of them by running a backend command directly.
To do so, first find the Debugger console in the global area widget, type a command into the
input box, and then press enter.
To run a backend command with the API, use the execute_backend_command API. For example, this will return all loaded modules (for LLDB adapter):
dbg.execute_backend_command('image list')
Hardware Breakpoints/Watchpoints
Hardware breakpoints and watchpoints are supported through the debugger UI, API, and direct backend commands.
For most use cases, the UI provides the easiest way to add hardware breakpoints - see the Add/Remove Hardware Breakpoints section above.
Using Backend Commands
For advanced use cases or when you need more control, you can use backend commands directly in the Debugger Console.
WinDbg/DbgEng
For WinDbg/EbgEng, hardware breakpoints can be added using the
ba (break-on-access)
command. It is followed by one of r/w/e to specify the access type, followed by an integer that specifies the size of
the access. For example:
ba e1 0x12345678: add a hardware execution breakpoint at 0x12345678ba r4 0x12345678: add a four-byte hardware read/write breakpoint at 0x12345678ba w2 0x12345678: add a two-byte hardware write breakpoint at 0x12345678
LLDB
breakpoint set --address 0x12345678 -H: add a hardware execution breakpoint at 0x12345678watchpoint set expression -w read -s 1 -- 0x100003f9f: add an one-byte hardware read watchpoint at 0x100003f9fwatchpoint set expression -w write -s 4 -- 0x100003f9f: add a four-byte hardware write watchpoint at 0x100003f9f- The parameter after the
-wcan beread | write | read_write - The parameter after the
-scan be1 | 2 | 4 | 8 - Run
help watchpoint set expressionfor more information on setting watchpoints
Managing Breakpoints
Breakpoints added outside the debugger (i.e., directly with a backend command) are not shown in the breakpoint widget. We can manage them using backend commands directly.
WinDbg/DbgEng
bl: show all the breakpointsbc n: delete the nth breakpointbd n: disable the nth breakpointbe n: enable the nth breakpoint
LLDB
breakpoint list: list all the breakpointsbreakpoint delete n: delete the nth breakpointbreakpoint disable n: disable the nth breakpointbreakpoint enable n: enable the nth breakpoint
Handle Fork
When a fork or vfork happens, LLDB follows the parent process by default. To change the behavior, one can set
common.followForkMode to child or parent accordingly.
Creating Dump Files
Right now we do not yet support keeping the contents of a dynamically allocated segment/section after debugging. However, as a workaround, we can use the WinDbg/DbgEng or LLDB's own capacity to generate a dump file which can then be loaded by the debugger.
WinDbg/DbgEng
.dump /ma FilePath- See docs for more details
LLDB
process save-core <file_path>
Listing Symbol At/Near an Address
Before we have the capacity to read symbols from the backend, as a workaround, we can check the symbols at or near a specific address.
WinDbg/DbgEng
ln Address- See docs for more details
LLDB
image lookup --address <address>
Debugging target with Administrative/sudo privileges
WinDbg/DbgEng
- enable the "Run as Administrator" setting in the Debug Adapter Settings. This will launch the debug server (dbgsrv.exe) with administrator privileges, allowing it to debug processes that require elevated permissions. This setting applies to both launching new processes and attaching to existing ones.
- You can also run Binary Ninja with Administrator privilege (not recommended).
LLDB
- Launch the process with the necessary privilege and connect to it using Binary Ninja debugger. See Remote Debugging Guide for more details.
- Or run the debug server with sudo and then use Binary Ninja debugger to connect to it. Then launch a process from there. See Remote Debugging Guide for more details.
- You must be an admin or in the _developer group on macOS to debug.
Settings
Binary Ninja debugger provides a wide range of settings to tweak its behavior. There are two categories of settings, the
first category affects the debugger globally, e.g., whether to annotate stack variables in the linear view
(controlled by setting debugger.stackVariableAnnotations). These
settings are like the regular Binary Ninja settings, and can be edited in the Settings view.
The second category affects the debug adapter, e.g., the executable path of the target. These are configured in the
Debug Adapter Settings dialog, which will automatically popup before you launch/connect/attach to a target.
Known Issues and Workarounds
There are some known issues and limitations with the current debugger. Here is a list including potential workarounds.
macOS
- For fat binaries on macOS, the currently viewed architecture will be debugged. For example, if a fat binary contains both x86 and arm code, and the current binary view is x86, then the debugger will debug x86 code in it.
- Cannot debug certain protected applications due to SIP (System Integrity Protection) on macOS. This includes applications in
/Applications. While this can be circumvented by disabling the SIP, it will pose serious threat to the safety of you device. So we do not recommend it and you will need to proceed with it at your own risk.
Self-modifying code
If the target contains self-modifying code (SMC), when the target stops, the code in the linear/graph view may not always be up-to-date. To force a memory cache update and re-analysis of the function, right click and select "Reanalyze Current Function" in the context menu.
To avoid the need to manually force an update frequently, set debugger.aggressiveAnalysisUpdate to true. Then the debugger will explicitly refresh the memory cache and re-analyze all functions every time the target stops. This is very helpful for obfuscated code with lots of SMC. However, it could cause lag in response if the target is large and has a lot of functions.
Network Adapter on Windows
On Windows, the debugging sometimes does not work if the machine does not have a network adapter. The reason for this is yet unknown; the debugger itself does not require a network connection to work. This is probably a bug in WinDbg itself, or a bug in the way that we use the DbgEng API.
To fix this, just create a network adapter in the VM but do not connect it to any actual network. The presence of a network adapter is enough for the debugger to work. We will also try to fix the issue in a proper way.
Slow launching Speed on Windows on Slow Networks
When the DbgEng adapter launches the target, the DbgEng automatically downloads symbols for the loaded DLLs from the Microsoft symbol server. As a result, if you are on a slow network, the launch can be slow. If you on a network that has access to the Internet, but not to the Microsoft symbol server in particular, the launch could also hang. To fix this, disconnect from the network before launching. We will also create a proper fix for it as tracked in https://github.com/Vector35/debugger/issues/519
Single-stepping using the API with LLDB Adapter
If you are debugging with the LLDB adapter and using the API to repeatedly single-step the target at a fast pace, you may run into a case that when you resume the target, instead of resuming the target, LLDB unexpectedly reports the target is still running and cannot be resumed. Failure to account for this can cause the debugger's internal state to de-synchronize and later lead to a crash.
We are still working to understand the nature of this unexpected behavior. We highly suspect that this is a timing
related issue in LLDB. Until we have a proper fix for it, please add a tiny wait before you resume the target, e.g.,
add a time.sleep(0.1) before dbg.step_into_and_wait(), like we do in our debugger unit test
script.
Troubleshooting
While we have tested the debugger in many scenarios, it may still malfunction in certain cases. Here are some basic steps to troubleshoot the situation. If you encounter a bug, please file an issue with reproduction steps, and if possible, attach the binary involved.
- If it crashes Binary Ninja, then it is always considered a bug.
- If the debugger cannot launch the file properly, first check to make sure the file can be executed properly outside of a debugger.
- Try to relaunch Binary Ninja and retry. There could be unintended side effects from previous debugging sessions. Whether it fixes the problem or not, please file an issue.
- Try to use the LLDB/WinDbg that comes with Binary Ninja to debug the file directly. If LLDB/WinDbg can debug it properly, then it is a Binary Ninja issue. Otherwise, it is a bug in the LLDB/WinDbg itself. In both cases, please file an issue and let us know which case it is.
The LLDB/WinDbg path can be found in the following path:
- Windows: first install the full WinDbg following this guide, and then use
%APPDATA%\Binary Ninja\windbg\DbgX.Shell.exeto debug it - Linux:
<Binary Ninja Installation folder>/plugins/lldb/bin/lldb - macOS:
/Applications/Binary Ninja.app/Contents/MacOS/plugins/lldb/bin/lldb
- Windows: first install the full WinDbg following this guide, and then use
Open-Source
Vector 35 is grateful for the following open-source or redistributable packages that are used in Binary Ninja debugger:
