Remote Debugging
Support Status
We currently support Windows remote debugging from Windows and Linux/macOS remote debugging from all platforms. Remote debugging of Windows executables from Linux/macOS is a planned feature.
We also support gdbserver/lldb-server/debugserver remote debugging from all platforms. Targets that expose a GDB stub that speaks the GDB RSP protocal, e.g., QEMU, VMWare, Qiling, Corellium, are also support from all platforms.
Debug Server v.s. Remote Process
There are two types of remote debugging: via a debug server or a remote process.
A remote process is straightforward -- it is a process that runs on the remote host. The debugger connects to it and then debugs it. If you have used gdbserver or debugserver previously, you probably already know about it.
A debug server is a server that runs on the remote host. The debugger connects to it and can instruct the debug server to launch a process as needed. Then the debugger can connect to the running process and debug it.
One advantage of using a debug server is that the user does not need to access the remote host to launch the target repeatedly—this can be done within the debugger.
Moreover, a debug server often offers more functionalities than launching a remote process. For example, the lldb-server supports reading and writing the remote file system, as well as executing shell commands on the remote host.
We recommend using a debug server whenever possible and only use the remote process as a backup.
For now, DbgEng adapter supports debug server, and LLDB adapter supports both debug server and remote process.
Windows Remote Debugging
This section explains how to remotely debug a process running on Windows. Right now this is only possible to do from another Windows machine. We know this is a highly useful feature to be able to do so from Linux or macOS, and please feel free to track our progress: issue 1, issue 2.
Preparing the Remote Host
- Download or copy the
debugger-win32.zipfrom the release page to the remote host - Extract it
Launching the Debug Server
To start a remote debugging session, launch the dbgsrv.exe on the remote machine as described below:
- Determine whether the target program is x64 or x86
- If the target is x64, then use the
dbgsrv.exeindebugger-win32\plugins\dbgeng\amd64 - If the target is x86, then use the
dbgsrv.exeindebugger-win32\plugins\dbgeng\x86 - If the version of
dbgsrv.exedoes not match the program, the debugger will behave unexpectedly
- If the target is x64, then use the
- Launch the dbgsrv by running
dbgsrv.exe -t tcp:port=<PORT>,server=<IP_ADDRESS>IP_ADDRESS:PORTis the IP and port the Binary Ninja will later connect to- For example,
dbgsrv.exe -t tcp:port=12345,server=192.168.72.25 - Note, the
server=part cannot be omitted.
- If this is done for the first time, the Windows firewall will pop up a confirmation dialog. Allow the operation.
- If the operation succeeds, the
dbgsrv.exewill keep running in the background. If any error occurs, it will show a message box. - If the target program requires Administrative privilege to run, run
dbgsrv.exefrom a command prompt with Administrative privilege
Connecting to the Debug Server
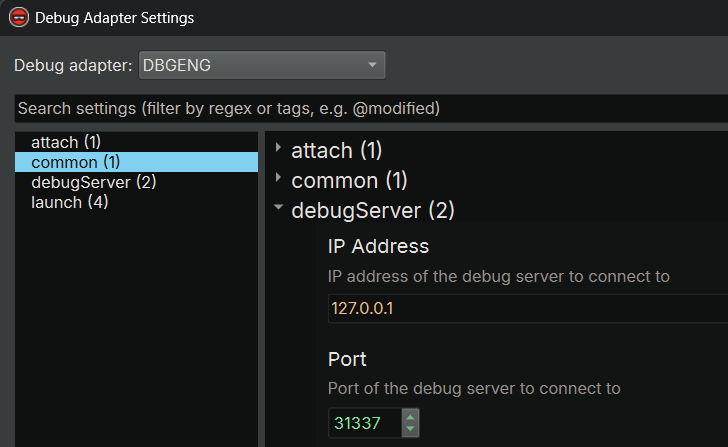
Now, connect to a debug server in Binary Ninja using DbgEng adapter.
- Open the binary you wish to debug
- Click "Debugger" -> "Connect to Debug Server" in the main window menu bar. The
Debug adapter settingsdialog will popup
- Make sure the "DbgEng" adapter is selected
- Navigate to the "debugServer" settings group (if it is not selected by default)
- Type in the
IP AddressandPortto connect to - Click
Accept. A message box will show up if the connection is successful
Now you can launch or connect to a process on the remote host. It works similarly as if you launch or attach to a process locally.
Launching a Process on the Remote Host
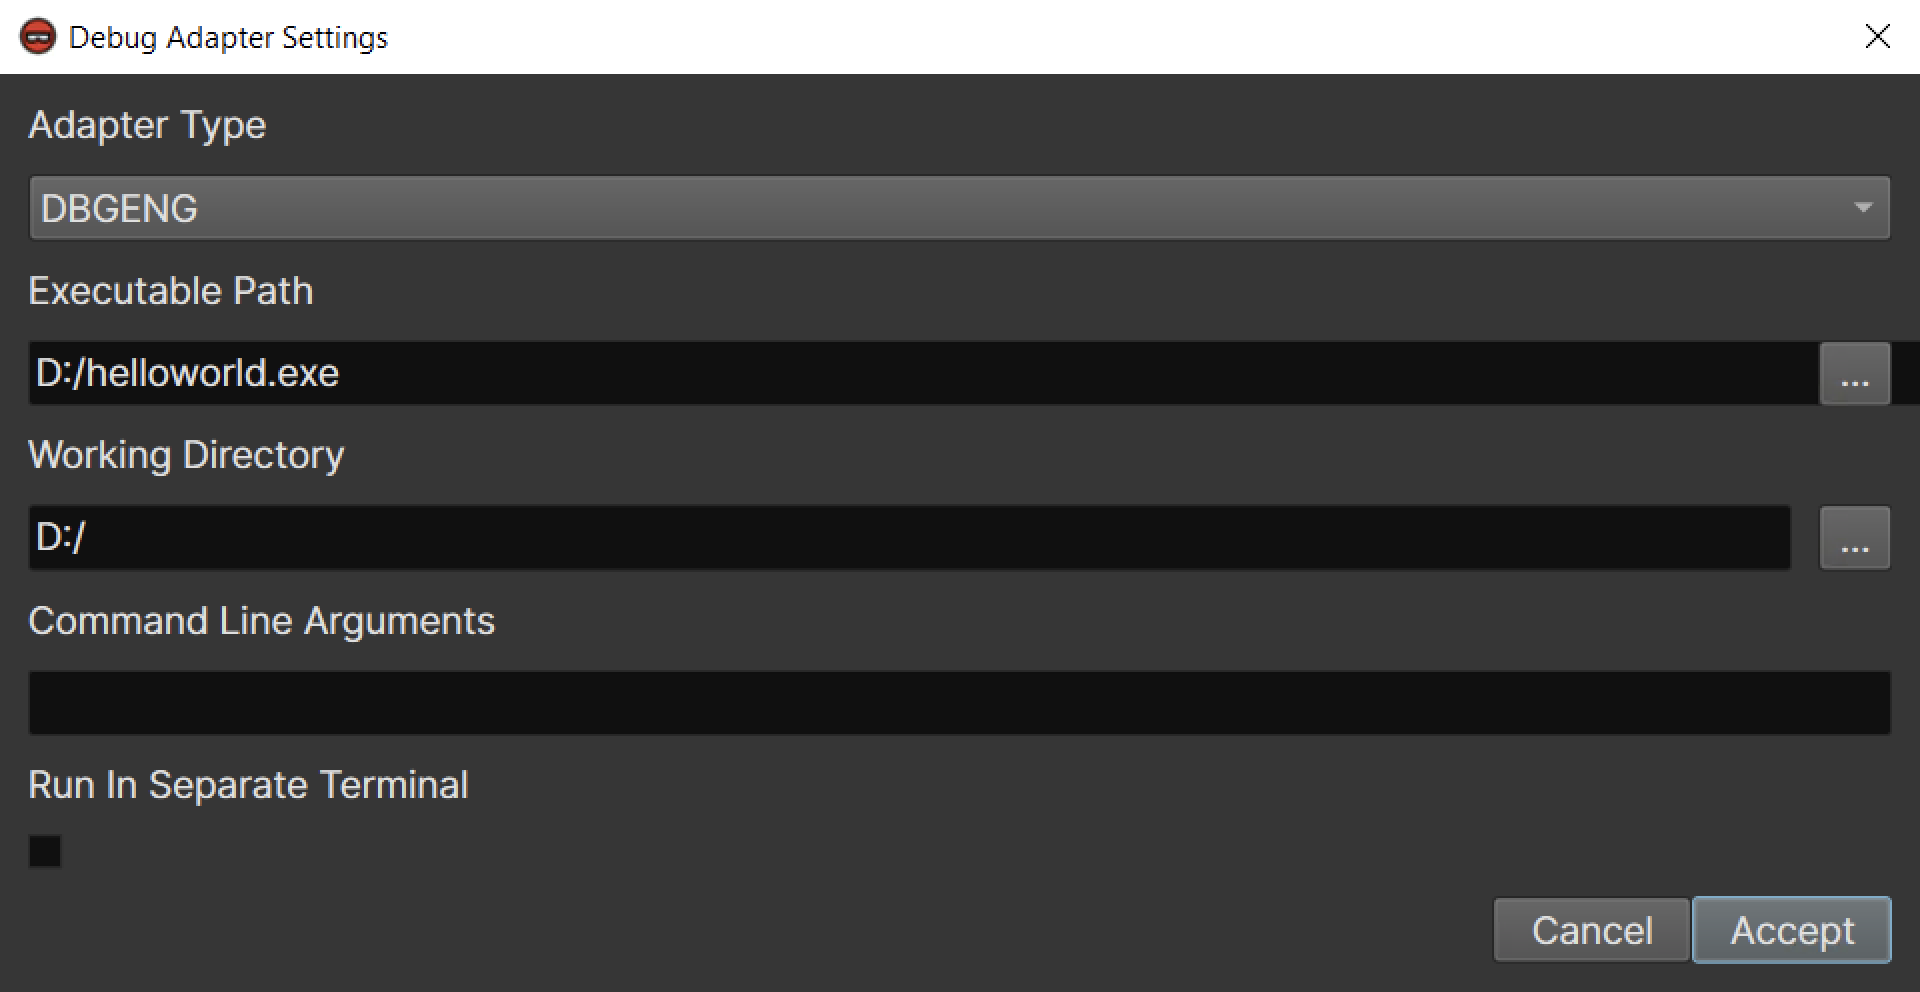
- Click "Debugger" -> "Debug Adapter Settings..." in the main window menu bar
- Make sure the "DbgEng" adapter is selected
- Navigate to the "launch" settings group
- Specify the executable path and working directory on the remote machine. This is likely different from the local path which is shown by default
- Launch the target
Attaching to a Process on the Remote Host
- Click "Debugger" -> "Attach To Process..." in the menu bar
- Select the process to attach to
- If the process is not listed, you might need to run
dbgsrv.exewith Administrator privilege - Click "Attach" to attach to the process and start debugging
When connected to the debug server, the debugger can launch or connect to a process multiple times using the same connection. There is no need to relaunch and reconnect to the debug server after the target exits.
To disconnect from the debug server, click "Debugger" -> "Disconnect from Debug Server". After that, if we launch the target, it will execute on the local machine. Be careful!
Linux Remote Debugging (Using Debug Server)
This section explains how to remotely debug a process running on Linux. This can be done from all platforms, i.e., Windows, Linux, and macOS.
There are two ways to do Linux remote debugging, i.e., using a debug server or a remote process. Debug server is the
recommended way. However, if it does not work for you, you can try using the remote process approach or using
gdbserver, which are documented later.
Preparing the Remote Host
- Download or copy
debugger-linux.zipfrom the release page to the remote host - Extract it
- One can also use the
lldb-serverthat can be installed via a package manager. However, it may have compatibility issues.
Launching the Debug Server
cd debugger-linux/plugins/lldb./lldb-server p --server --listen 0.0.0.0:31337
Specifying 0.0.0.0 instructs lldb-server to listen on all interfaces. You can also specify a particular IP address of
an interface that the Binary Ninja debugger will later connect to.
Connecting to the Debug Server
- Open the binary you wish to debug
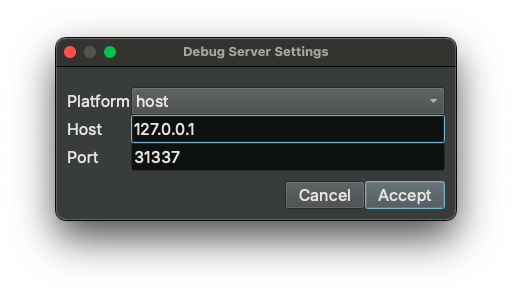
- Click "Debugger" -> "Connect to Debug Server" in the main window menu bar. The
Debug adapter settingsdialog will popup
- Navigate to the "debugServer" settings group (if it is not selected by default)
- Type in the
IP AddressandPortto connect to - Select
remote-linuxin thePlatformdropdown menu - Click
Accept. A message box will show up if the connection is successful
Launching a Process on the Remote Host
- Click "Launch", and the
Debug Adapter Settingsdialog will popup - Navigate to the "launch" settings group (if it is not selected by default)
- Set the
Working Directoryto the remote directory that you wish to launch the process in. Do not leave the path unchanged since it will then be a local path, and there will be an error during launch. - Do NOT change the
Executable Pathto a remote path. Set it to the local path where the executable is in. During launch, LLDB will copy the executable to the remote host, put it in the working directory we supplied above, and launch it. Setting a remote path here will cause errors. LLDB is smart enough to check the hash of the file so that it will only copy the file once. - Configure other parameters as needed
- Launch the target
Attaching to a Process on the Remote Host
- Click "Debugger" -> "Attach To Process..." in the menu bar
- Select the process to attach to
- If the process is not listed, you might need to run
lldb-serverwith sudo - Click "Attach" to attach to the process
When connected to the debug server, the debugger can launch the executable multiple times using the same connection. There is no need to relaunch and reconnect to the debug server after the target exits.
To disconnect from the debug server, click "Debugger" -> "Disconnect from Debug Server". After that, if we launch the target, it will execute on the local machine. Be careful!
Linux Remote Debugging (using Remote Process)
If the debug server does not work, you can try Linux remote debugging via the remote process approach. This uses
lldb-server in GDB mode and might be simpler to configure.
Preparing the Remote Host
- Download or copy
debugger-linux.zipfrom the release page to the remote host - Extract it
- One can also use the
lldb-serverthat can be installed via a package manager. However, it may have compatibility issues.
Launching or Attaching to a Remote Process
cd debugger-linux/plugins/lldb- To launch a new process, run
./lldb-server g 0.0.0.0:31337 -- /path/to/helloworld foo bar/path/to/helloworldis the path of the executablefoo barare two arguments
- To attach to a running process by PID, run
./lldb-server g 0.0.0.0:31337 --attach 12341234is the PID of the target process
Specifying 0.0.0.0 instructs lldb-server to listen on all interfaces. You can also specify a particular IP address of
an interface that the Binary Ninja debugger will later connect to.
Connecting to the Remote Process
- Open the binary you wish to debug
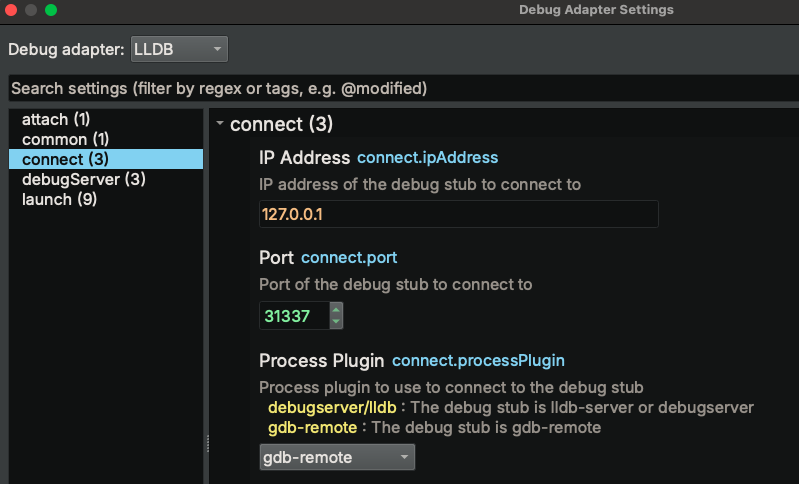
- Click "Debugger" -> "Connect to Remote Process" in the main window menu bar. The
Debug adapter settingsdialog will popup
- Navigate to the "connect" settings group (if it is not selected by default)
- Type in the
IP AddressandPortto connect to - select
gdb-remoteFor theProcess Plugin - Click
Accept - The debugger will now connect to the process launched or attached to in the previous step and start debugging
When using the remote process mode, when the debugging stops (the target exits or gets killed), the connection is automatically closed. There is no extra steps needed to close the connection.
If you wish to debug the target again, you will need to repeat the steps above to launch or attach to a remote process.
MacOS Remote Debugging (Using Debug Server)
This section explains how to remotely debug a process running on MacOS. This can be done from all platforms, i.e., Windows, Linux, and macOS.
You must use a debug server on macOS. Remote process does not work on macOS.
Preparing the Remote Host
- Download or copy
debugger-darwin.zipfrom the release page to the remote host - Extract it
Launching the Debug Server
cd debugger-darwin/plugins/lldb./lldb-server p --server --listen 0.0.0.0:31337
Specifying 0.0.0.0 instructs lldb-server to listen on all interfaces. You can also specify a particular IP address of
an interface that Binary Ninja debugger will later connect to.
Connecting to the Debug Server
- Open the binary you wish to debug
- Click "Debugger" -> "Connect to Debug Server" in the main window menu bar. The
Debug adapter settingsdialog will popup
- Navigate to the "debugServer" settings group (if it is not selected by default)
- Type in the
IP AddressandPortto connect to - Select
remote-macosxin thePlatformdropdown menu - Click
Accept. A message box will show up if the connection is successful
Launching a Process on the Remote Host
- Open the
Debug Adapter Settingsdialog - Set the
Working Directoryto the remote directory that you wish to launch the process in. Do not leave the path unchanged since it will then be a local path, and there will be an error during launch. - Do NOT change the
Executable Pathto a remote path. Set it to the local path where the executable is in. During launch, LLDB will copy the executable to the remote host, put it in the working directory we supplied above, and launch it. Setting a remote path here will cause errors. LLDB is smart enough to check the hash of the file so that it will only copy the file once. - Launch the target
Attaching to a Process on the Remote Host
- Click "Debugger" -> "Attach To Process..." in the menu bar
- Select the process to attach to
- If the process is not listed, you might need to run
lldb-serverwith sudo - Click "Attach" to attach to the process
When connected to the debug server, the debugger can launch the executable multiple times using the same connection. There is no need to relaunch and reconnect to the debug server after the target exits.
To disconnect from the debug server, click "Debugger" -> "Disconnect from Debug Server". After that, if we launch the target, it will execute on the local machine. Be careful!
GDB Server Remote Debugging
GDB server is a widely used mechanism for remote debugging. On Linux systems, there is a gdbserver executable that can
be installed and executed. Many other projects, e.g., QEMU, also include a gdb stub that speaks the same protocol.
Please note that although the "GDB server" has a "server" in its name, normally it operates as a remote process. In other words, the debugging is one-shot, that when the target exits, the connection gets closed. If you wish to debug it again, you need to start the GDB server again.
You can connect to a gdbserver/GDB Stub using either the LLDB adapter or the GDB RSP adatepr.
Launching GDB Server
- On Linux, to launch a new process, run
gdbserver 0.0.0.0:31337 -- /path/to/helloworld foo bar/path/to/helloworldis the path of the executablefoo barare two arguments
- On Linux, to attach to a running process by PID, run
gdbserver 0.0.0.0:31337 --attach 12341234is the PID of the target process
- For QEMU, add
-s -Sto the command line- For example,
qemu-system-x86_64 -drive file=disk.img,format=raw -bios bios.bin -s -S -sstarts QEMU with a GDB server listening on TCP port 1234-Sstarts QEMU in a paused state, allowing you to connect with GDB before the virtual CPU starts executing- You can specify a different port to listen on by replacing
-swith-gdb tcp::port
- For example,
- For other tools that also speak the GDB remote debugging protocol, please refer to their documentation on how to configure it
Recent versions of the GDB server also support a debug server mode, which can be active using
gdbserver --multi 0.0.0.0:31337. However, the Binary Ninja debugger does not yet support connecting to the GDB server in
this mode.
Connecting to GDB Server (using LLDB adapter)
- Open the binary you wish to debug
- Click "Debugger" -> "Connect to Remote Process" in the main window menu bar. The
Debug adapter settingsdialog will popup
- Select
LLDBas the adapter - Navigate to the "connect" settings group (if it is not selected by default)
- Type in the
IP AddressandPortto connect to - select
gdb-remoteFor theProcess Plugin - Click
Accept
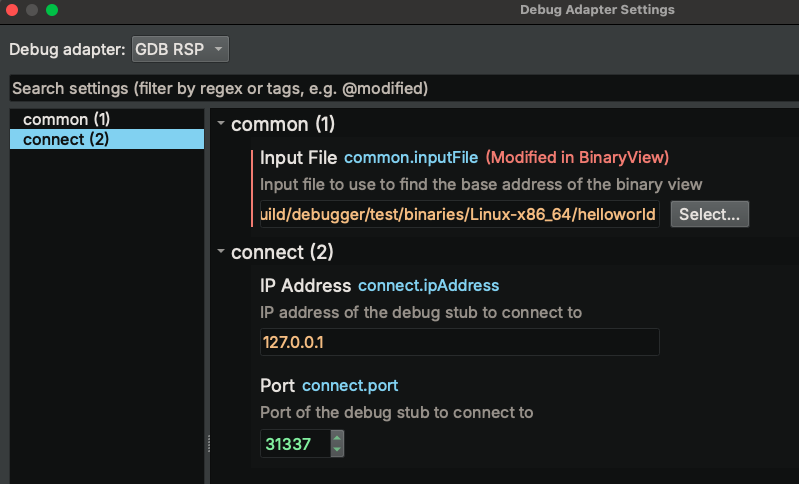
Connecting to GDB Server (using GDB RSP adapter)
- Open the binary you wish to debug
- Click "Debugger" -> "Connect to Remote Process" in the main window menu bar. The
Debug adapter settingsdialog will popup
- Select
GSB RSPas the adapter - Navigate to the "connect" settings group (if it is not selected by default)
- Type in the
IP AddressandPortto connect to - Click
Accept
iOS Remote Debugging
Binary Ninja debugger supports debugging an iOS app running on a real device or an emulator. The process is
similar to macOS remote debugging, except that we need to run debugserver on the device rather than lldb-server.
Preparation
Setting up an iOS device or emulator for debugging is challenging. A step-by-step guide is out of scope here. We assume the user can already debug an iOS app using the LLDB command line and wish to debug it within the Binary Ninja debugger.
The high-level steps are:
- Get SSH access to the device. This can be done by either jailbreaking the device or using an emulator
- Extract the
debugserverexecutable from the developer disk image that comes with the XCode - Sign it with a proper entitlements plist to enable it to debug all processes
- Upload the signed
debugserverto the remote system
Launching or Attaching to the target
- SSH into the remote host
- To launch a new process, run
./debugserver 0.0.0.0:31337 /path/to/helloworld foo bar/path/to/helloworldis the path of the executablefoo barare two arguments
- To attach to a running process by PID, run
./debugserver 0.0.0.0:31337 --attach=12341234is the PID of the target process
Connecting to the target
- Open the binary you wish to debug
- Click "Debugger" -> "Connect to Remote Process" in the main window menu bar. The
Debug adapter settingsdialog will popup
- Navigate to the "connect" settings group (if it is not selected by default)
- Type in the
IP AddressandPortto connect to - select
debugserver/lldbFor theProcess Plugin - Click
Accept - The debugger will now connect to the process launched or attached to in the previous step and start debugging
Android Remote Debugging
Binary Ninja debugger supports debugging an Android app running on a real device or an emulator. The process is similar to GDB server remote debugging.
Preparation
Setting up an Android device or emulator for debugging requires a few steps. A step-by-step guide is out of scope here. We assume the user can already debug an Android app using the GDB command line and wish to debug it within the Binary Ninja debugger.
The high-level steps are:
- Get SSH access to the device. This can be done by either rooting a real device or using an emulator
- Install the Android NDK on your computer
- Find the
gdbserverorgdbserver64executable in NDK - Upload it to the remote host
Launching or Attaching to the target
- SSH into the remote host
- To launch a new process, run
gdbserver 0.0.0.0:31337 -- /path/to/helloworld foo bar/path/to/helloworldis the path of the executablefoo barare two arguments
- To attach to a running process by PID, run
gdbserver 0.0.0.0:31337 --attach 12341234is the PID of the target process
Connecting to the target
- Open the binary you wish to debug
- Click "Debugger" -> "Connect to Remote Process" in the main window menu bar. The
Debug adapter settingsdialog will popup
- Navigate to the "connect" settings group (if it is not selected by default)
- Type in the
IP AddressandPortto connect to - select
gdb-remoteFor theProcess Plugin - Click
Accept
